


Monday, August 5, 2013
TLT ETF: Treasury Long Bond: Today's EchoVector Pivot Point Chart And Analysis
Treasury long bond prices have seen difficult times recently. Since the beginning of May this year, and shortly after the Federal Reserve hinted it was developing a schedule for winding down its $85 billion dollar per month bond purchasing program, Fed 'tapering' speculation hit the bond market hard, and sent the price of bonds down rather quickly, and quite dramatically. An 8% drop occurred during just that first month of May, from about $124 to about $114 as measured by the TLT ETF.
And, although the Fed has since attempted to mitigate its language and posture to indicate that purchasing will remain steady, the bond market has continued to weaken further. Investors have elected to continue their strong preference for rising stocks.
June remained poor for bond prices, seeing The TLT drop another 6 points from $114 to $108, and setting up an additional early July drop to nearly $106, before the damage to prices seemed to halt.
Many article's followed, with some analysts seeing bonds stabilising, and again 'becoming a buy', while other analysts warned of continuing price weakness into the end of the year, and potentially beyond. On balance, treasury long bond prices did stabilise through much of the remainder of July, finding continued technical support in this new price range.
However, last week's midweek Federal Reserve activity apparently provided little additional lift to bond prices; and, in fact, bonds broke down to new annual lows the very next day, on Thursday, before coming to last week's end. Thursday's better than expected ADM payroll number and ISM manufacturing number also appeared catalysts to the breakdown. And Friday's worse than expected job numbers, and further moderating comments by the St. Louis Fed President on "Fed Tapering," helped halt Thursday's dire looking strong price down-pressure and continued momentum, at least going into the weekend.
In this context, today is a good day for review of a price chart of the treasury long bond from an EchoVector Pivot Point Analysis Perspective for occurrences of possible price symmetries that may be forming within this past week's and months' context, and to review these symmetries' potential trading implications. This coming week is sure to be a significant week in the bond market.
In this analysis I will review two primary EchoVector Pivot Point Perspectives for their price symmetries and for their individual and combined trading implications.
The first echovector perspective is a four-year daily price action chart of the TLT which highlights a current key active presidential cycle echovector and a 'fan' of potential echo-extension vectors from a key presidential cycle echo-back-date, for context.
The second echovector perspective is a 2-year daily price action chart of the TLT which includes a currently active congressional cycle echovector which may be about to pivot, and on which I will be focusing, and several confirming shorter term cycle echovectors occurring in parallel also of interest.
I am using the TLT ETF and its price charts as a proxy for long bond treasuries market price action.
TLT ETF 4-YEAR DAILY OHLC
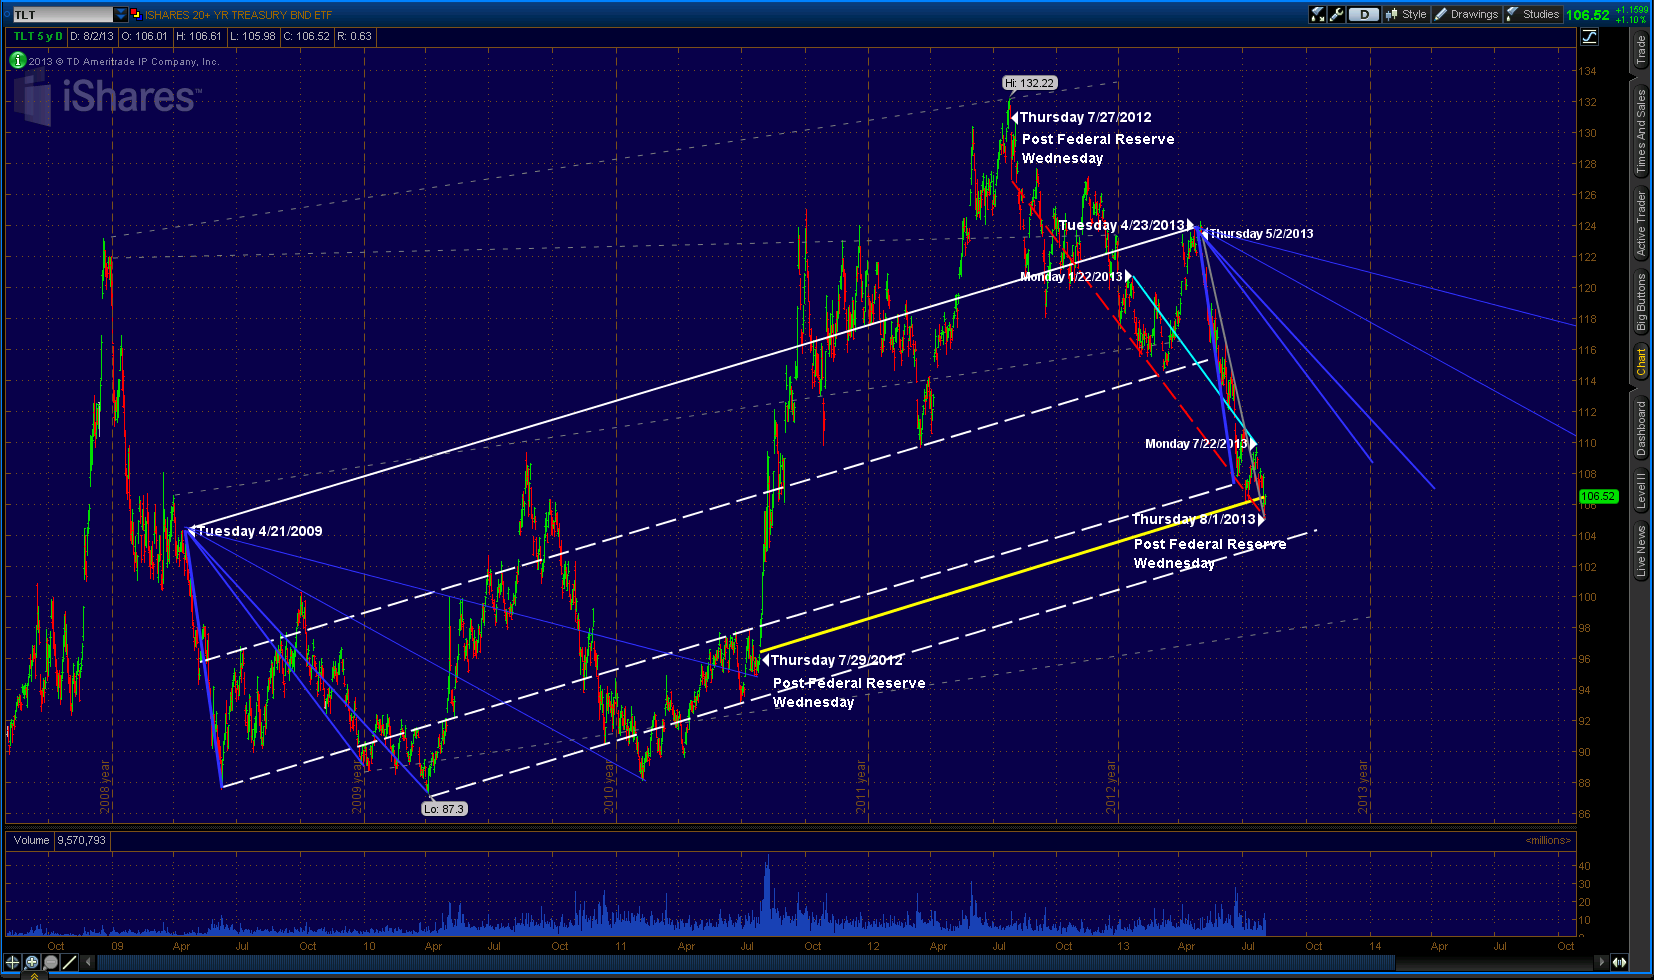
This first chart presents and highlights the key active 4-year presidential cycle echovector at work on Thursday 4/23/2103 along with that day's coordinate echo-back-date of Thursday 4/21/2009.
At the time, although many analysts were advancing the position of moving into bonds as an insurance hedge against a possibly overheated stock market, I was instead advancing caution and warning readers of a potential head-and-shoulders pattern in bonds possibly in the making. The wisdom of taking profits on the strong double-long swing trade opportunity alert I previously issued the week of March 11TH. This chart highlights the rather overall precarious nature of this year within the last phase of this cycle.
At the time, although many analysts were advancing the position of moving into bonds as an insurance hedge against a possibly overheated stock market, I was instead advancing caution and warning readers of a potential head-and-shoulders pattern in bonds possibly in the making. The wisdom of taking profits on the strong double-long swing trade opportunity alert I previously issued the week of March 11TH. This chart highlights the rather overall precarious nature of this year within the last phase of this cycle.
A longer term chart highlighting the 8-year regime change cycle clearly shows the lows of mid-March 2013 and its correlate lows in both 2009 and 2005, and active coordinate echovector support then each year. The regime change cycle chart also shows the symmetrical price extension levels following in the second quarter of each of those years, and indicates little price advantage going forward into the end either year; in fact, it reveals significant price fall each of those years instead. Illustrative charts regarding this additionally revealing analysis and context were posted on SeekingAlpha April 13TH, and can still be viewed there for a further long term framework for viewing this month's coming price action.
So far, the price behavior during this current phase of the presidential cycle is behaving consistently and coordinately subsumptive to the regime change cycle in which it occurs.
TLT ETF 2-YEAR DAILY OHLC

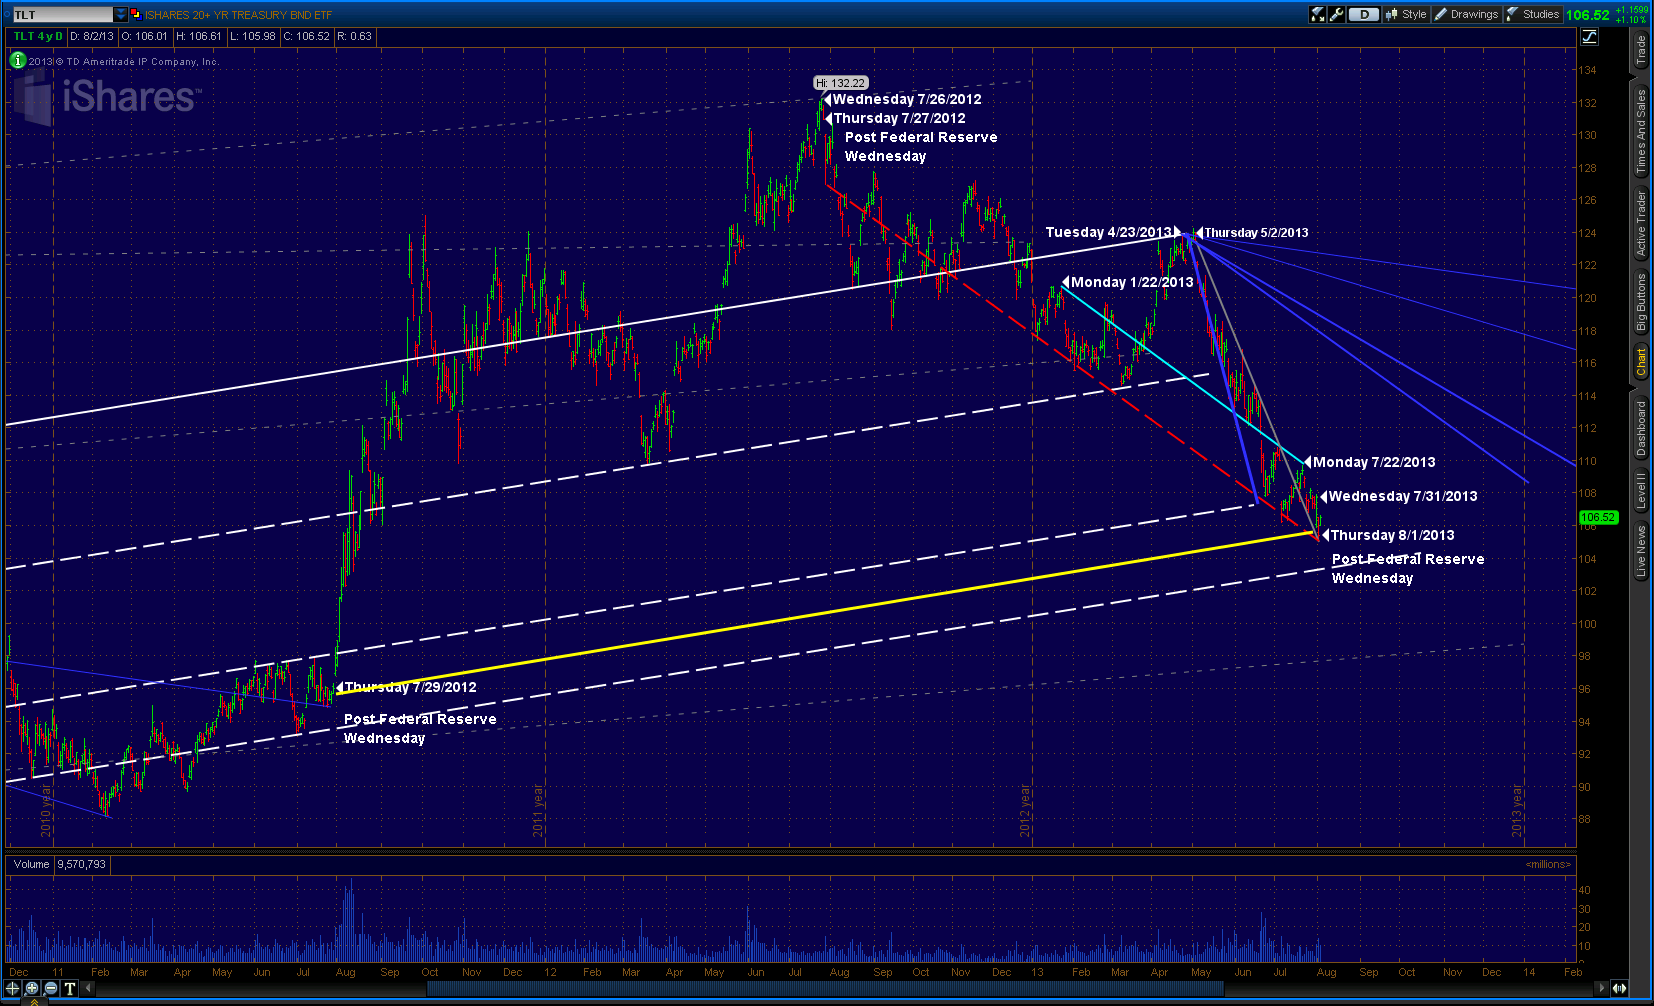
This second chart focuses on price activity and potentially revealing price symmetries occurring in the long bond the last two years.
Notice first that the active two year congressional cycle echovector for this past Thursday 8/1/2013 and its coordinate echo-back-date of Thursday 7/29/2012 is moving in significant parallel with the active presidential cycle echovector previously highlighted.
Note also in both 2011 and 2012 the following week presented strong pivot extension price pressure following The Fed's comments during the prior week. In 2011 the price reaction to Fed comments was strong price uplift that was also coordinate with presidential cycle uplift of similar basing in the lower price range in 2007. In 2012 the reaction was significant price down-pressure and price fall, prices having already rallied to the upper end of the active longer term echovector price range.
Also notice the current price momentum and slope symmetry in the bi-quarterly echovector (6 months, in solid aqua blue) for this year from Monday 7/22/2013 and coordinate echo-back-date Monday 1/22/2013, and the parallel active annual price echovector for this past week's Post Fed low (in spaced red).
Also note how relative coordinate price weakness followed well into the middle of the following month from the end of July last year, the end of January this year, and the end of July this year, and how this strong echovector slope and channel presently still appears intact.
This annual echovector price perspective and its price action might serve to argue as evidence for continued price down-pressure bias from a technical echovector perspective, even in the wake of both the active presidential cycle echovector's and the congressional cycle echovector's strong timing price up-biases going forward into this week in regard to potential weights on shorter term swing trading. We should begin to notice a key pivot in the congressional cycle echovector this week if these longer term echoes happen to become mitigated by nearer term annual price pressure, and contra-echoes begin to emerge. This week will prove very interesting.
CONCLUSIONS AND POSITIONING IMPLICATIONS
Remaining nimble is the key this week.
I've mentioned that I plan to look at opportunities to add to a short term swing trading position in the TLT I opened last week, but will keep an eye on the annual, bi-annual and extremely strong quarterly price down-pressures and downward momentums evidence in the above chart, and for possible continuations in these down pressures, as well as look for a failure in the price echo (and similar strong price extension) of the 2-year congressional cycle echovector, a failure that could result in a dramatic downward pivoting of this echovector as we move through the next two weeks.
I also remain open to closing out my short term long in these events, and considering a position reversal. A breakout above the downward projection of the down-trending bi-annual echovector (highlighted in solid aqua blue), which also so very interestingly reflects the slope of the currently active annual echovector for last week's (and this year's) price low would be reinforcing and bullish. But even this potential breakout should be viewed within the context of the two (solid blue purple) presidential cycle forward price vectors pointing to the end of the year and the beginning of next year, as measured from this spring's top.
Regarding any long term short positions that may still be open from that top, I would tend to consider them primarily mature, especially in the short term and at the current level of extension, and to possibly be at risk. Therefore I would be ready to monitor them closely, and be analysing their potential cover or continuance within short term trading considerations.
One way to employ such a straddle would be to utilise the TLT ETF mentioned in this analysis by setting up an advanced trade technology approach (see "On-Off-Through Vector Target Price Switch") to positioning and position management, with appropriate dynamic triggers and stops included; for example, at $106.50 on the TLT.I
I also remain open to closing out my short term long in these events, and considering a position reversal. A breakout above the downward projection of the down-trending bi-annual echovector (highlighted in solid aqua blue), which also so very interestingly reflects the slope of the currently active annual echovector for last week's (and this year's) price low would be reinforcing and bullish. But even this potential breakout should be viewed within the context of the two (solid blue purple) presidential cycle forward price vectors pointing to the end of the year and the beginning of next year, as measured from this spring's top.
Regarding any long term short positions that may still be open from that top, I would tend to consider them primarily mature, especially in the short term and at the current level of extension, and to possibly be at risk. Therefore I would be ready to monitor them closely, and be analysing their potential cover or continuance within short term trading considerations.
If you believe the time has come to re-enter the treasury long bond, I suggest using active and adjustable straddling positions to manage your exposure to general price level changes in either direction. Setting advanced management straddles at key coordinate forecast levels is an effective and opportune measure, and advanced trade strategy I think prudent to mention. Such an approach to the bond market at this time could prove very valuable at engaging and effectively managing risk and reward.
One way to employ such a straddle would be to utilise the TLT ETF mentioned in this analysis by setting up an advanced trade technology approach (see "On-Off-Through Vector Target Price Switch") to positioning and position management, with appropriate dynamic triggers and stops included; for example, at $106.50 on the TLT.I
f you believe the time has come to re-enter the treasury long bond, I suggest using active and adjustable straddling positions to manage your exposure to general price level changes in either direction. Setting advanced management straddles at key coordinate forecast levels is an effective and opportune measure, and advanced trade strategy I think prudent to mention. Such an approach to the bond market at this time could prove very valuable at engaging and effectively managing risk and reward.
To perform the short side of the straddle, set a short trigger below $106.50 on the TLT pre-programmed as a "repeating short trigger switch" at this trigger level on reverse down tick action through the trigger price, with stops set to activate on reverse uptick up-through action. To perform the long side of the straddle, set a long trigger above 106.50 pre-programmed as a "repeating long trigger switch" on reverse uptick action through the trigger, with stops set to activate on reverse downtick down-through action.
I'm hoping the EchoVector Pivot Point Analysis Perspectives provided in this article help lend additional context to your potentially already broad and extensive bond market view and analysis, and that they help you to further sharpen your clarity and insight. I always recommend considering a broad range of considerations, analysis and approaches when assessing the markets for any investment decision.
COLOR CODE GUIDE FOR CHARTS
1. Presidential Cycle EchoVector (4 Year): Long White
2. Congressional Cycle EchoVector (2 Year, Day of week): Yellow
3. Annual Cycle EchoVector (1 Year): Red
4. Bi-Quarterly Cycle EchoVector (6 Months): Blue
5. Quarterly Cycle EchoVector (3 Months): Grey
6. Select Support and/or Resistance Vectors and/or Related Price Extension Vectors (of Varied Lengths): Navy blue and/or Blue Purple
Thanks for reading. Good luck in your bond investing this week.
Posted by EchoVectorVEST MDPP PRECISION PIVOTS at 2:06 AM
No comments:
Post a Comment